Mapping 123 million neonatal, infant and child deaths between 2000 and 2017
Gains in child survival have long served as an important proxy measure for improvements in overall population health and development1,2. Global progress in reducing child deaths has been heralded as one of the greatest success stories of global health3. The annual global number of deaths of children under 5 years of age (under 5)4 has declined from 19.6 million in 1950 to 5.4 million in 2017. Nevertheless, these advances in child survival have been far from universally achieved, particularly in low- and middle-income countries (LMICs)4. Previous subnational child mortality assessments at the first (that is, states or provinces) or second (that is, districts or counties) administrative level indicate that extensive geographical inequalities persist5,6,7.
Progress in child survival also diverges across age groups4. Global reductions in mortality rates of children under 5—that is, the under-5 mortality rate (U5MR)—among post-neonatal age groups are greater than those for mortality of neonates (0–28 days)4,8. It is relatively unclear how these age patterns are shifting at a more local scale, posing challenges to ensuring child survival. To pursue the ambitious Sustainable Development Goal (SDG) of the United Nations9 to “end preventable deaths of newborns and children under 5” by 2030, it is vital for decision-makers at all levels to better understand where, and at what ages, child survival remains most tenuous.
-
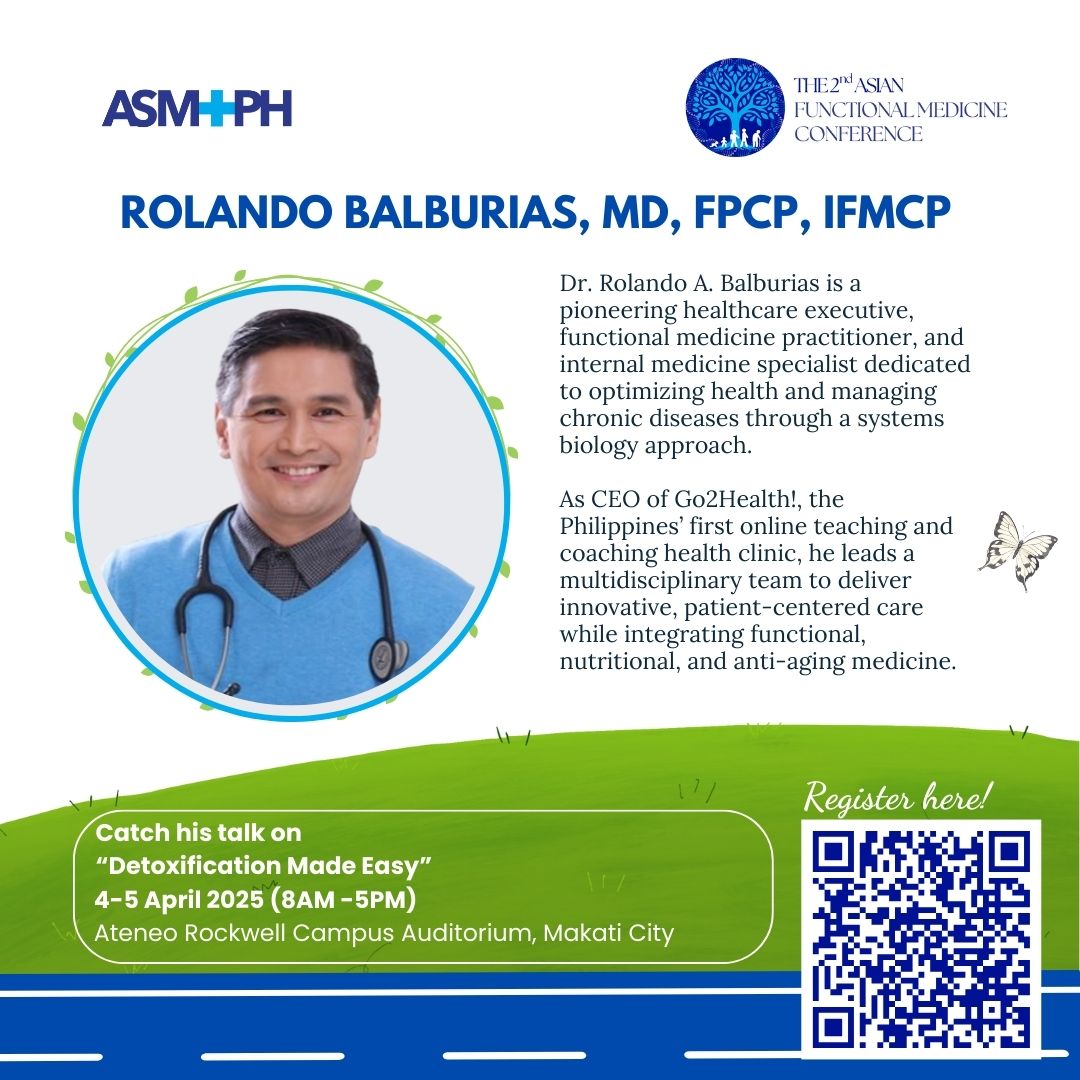
Detoxification Made Easy: Dr. Rolando Balburias’ Expert Approach at the 2nd Asian Functional Medicine Conference
Unlock the secrets of effective detoxification with Dr. Rolando Balburias at the 2nd ASMPH Functional Medicine Conference! His practical session "Detoxification Made Easy" cuts through the complexity to deliver a clear, systematic approach to supporting your body's natural cleansing processes. Learn to confidently guide patients through the entire detoxification journey with evidence-based tools and techniques that deliver real results. To know more about the other speakers, please visit: https://go.ateneo.edu/FMConference-program #ASMPH2025
-
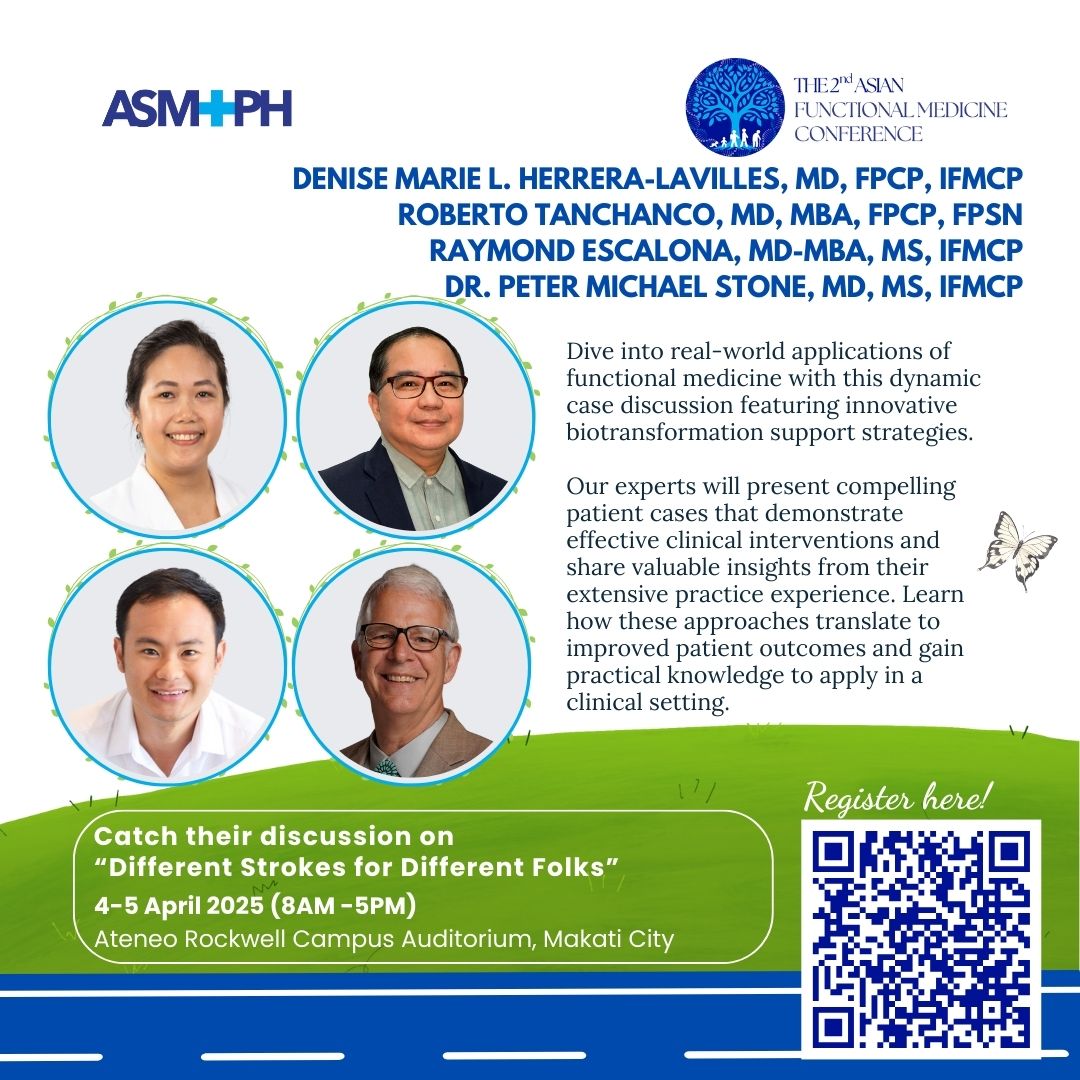
Unlocking Personalized Healing: The Role of Functional Medicine in Patient Care
In today’s evolving healthcare landscape, the demand for personalized and holistic approaches to well-being is growing. Functional medicine is leading this transformation, offering innovative strategies that target the root causes of illness rather than just managing symptoms. Whether you’re a healthcare professional, a medical student, or simply someone interested in optimizing health, the 2nd Asian Functional Medicine Conference is an event you won’t want to miss. On April 4-5, 2025, at the Ateneo Rockwell Campus Auditorium in Makati City, esteemed experts in functional medicine will come together for an engaging discussion titled “Different Strokes for Different Folks.” This dynamic session will feature real-world applications of functional medicine, focusing on biotransformation support strategies that improve health outcomes.